Can we power the world with solar panels?
How many times have you heard the claim that “we can power the world with solar photovoltaic (PV) power”. In this article, I will subject this claim to a bounding engineering analysis, purely in terms of land area. It is trivial calculation to calculate how much land area of solar farm is required to supply the equivalent energy demand averaged over a year. For each country, you simply find out how much energy it uses then you find out how much electricity solar power produces per unit land area in that country.
For the energy demand I will use BP Statistical Review of World Energy. And for the solar capacity, I will use a study from SolarGIS, funded by the World Bank.

Energy Consumption
The global annual primary energy consumption (using the substitution method (a.k.a. ‘input-equivalent basis’)) is 595 ExaJoules (595.15E+18 Joules) according to the most widely used measure, the Statistical Review of World Energy, by BP. Primary energy is the combustion energy of the fossil fuels where they enter the supply chain before any further conversion or transformation process.
This 595 ExaJoules has an equivalent energy content to 97 billion barrels per year of crude oil—a volume of 15.5 km³ (assuming 160 L/barrel)—a flow rate of 491 m³/s—equivalent to the flow rate of either the Rhone or Saône, as they flow through Lyon. More than 5 times the flow rate of the Thames as it meets the North Sea. This volume would need 48,500 large oil tankers to transport it. The energy consumption alone amounts to 300,000 Saturn 5 rockets, at launch; enough energy to boil Loch Ness within an hour.

The river Rhone, with the water replaced by oil. The global energy consumption rate in terms of crude oil equivalent.
Note that, of this total energy equivalent, only a third is actually oil. BP reports a global oil consumption of 89.877 million barrels per day, which equates to 32 billion barrels per year. That is still equivalent to the Thames, in London, in winter during high flow.
Worldwide, more than three quarters of primary energy consumption is in the form of fossil fuels. This remains unchanged from the 1997, the date of the Kyoto protocol.
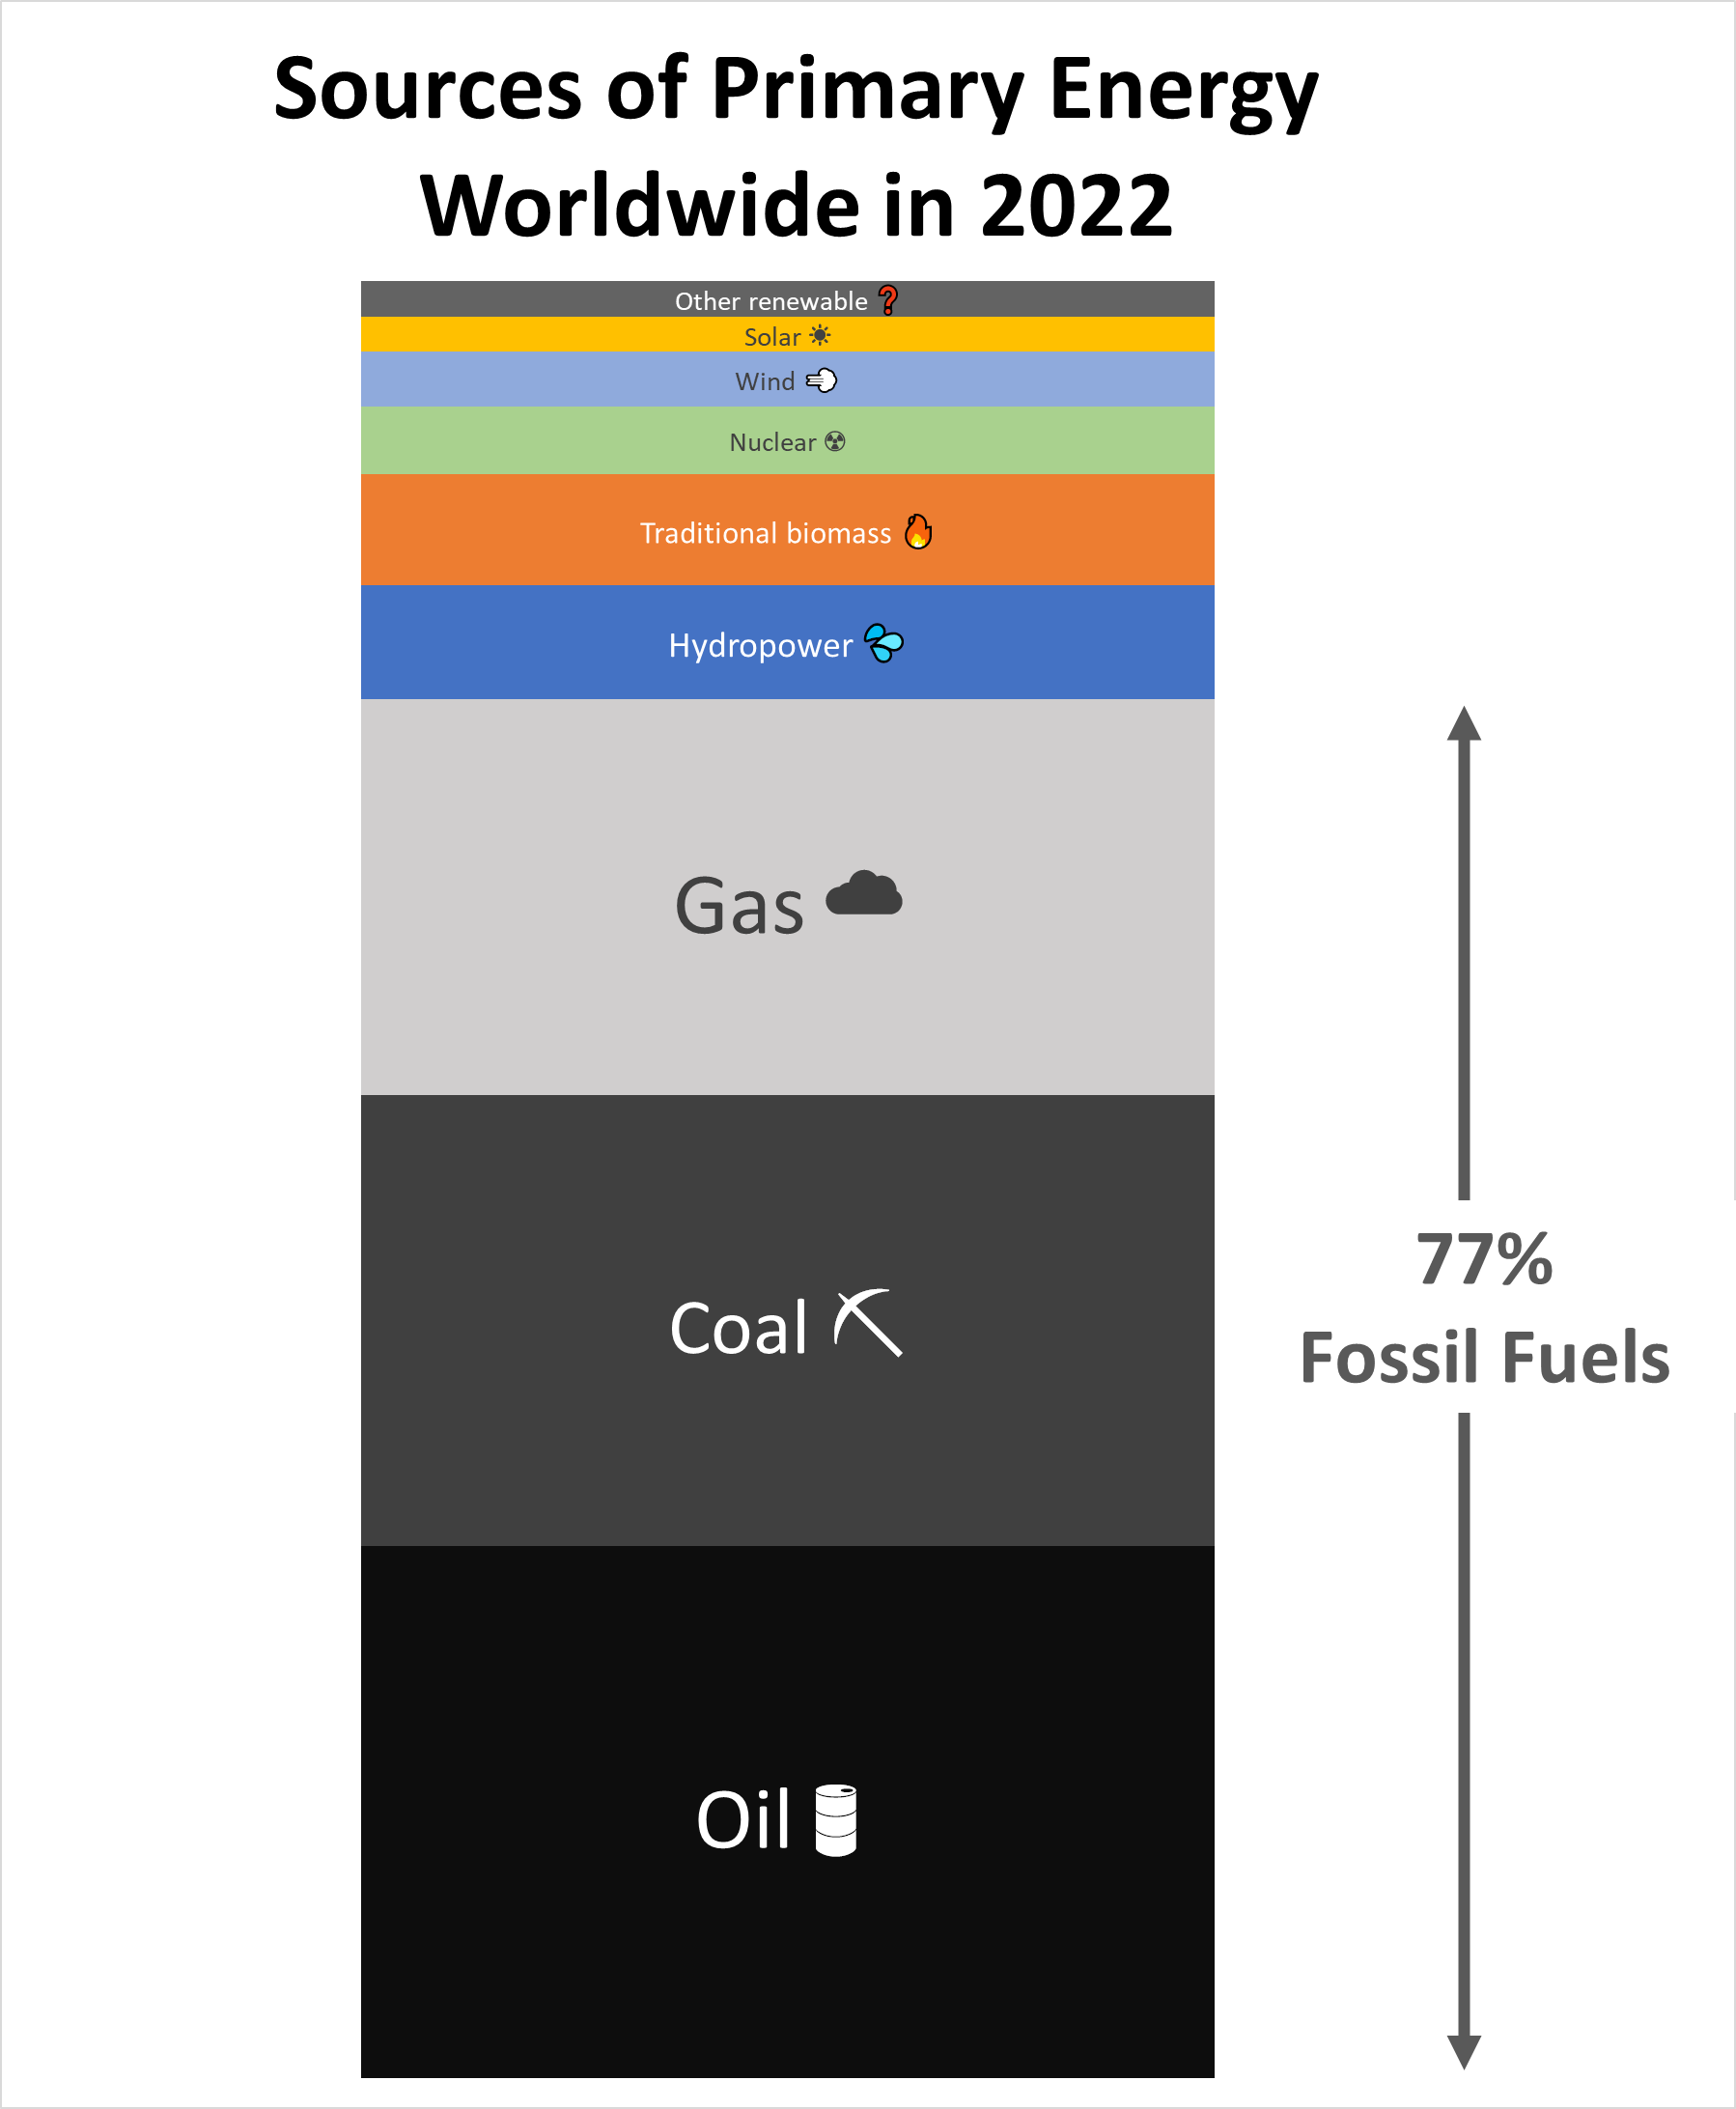 Energy Production and Consumption - Our World in Data
In fact, the fossil fuel proportion was actually decreasing from 1970 to 1999, then increasing until 2012.
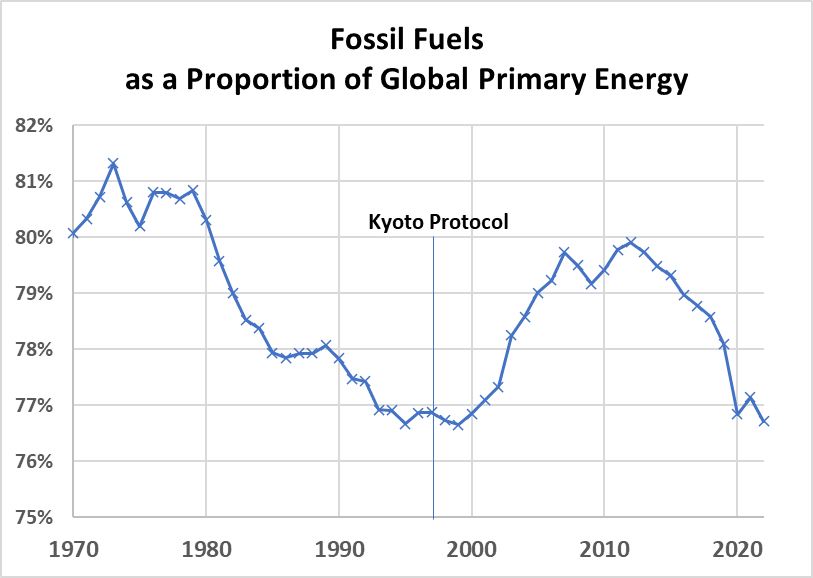 Energy Production and Consumption - Our World in Data
First assumption: ignore waste heat from electrical generation
Of the primary energy consumption shown above, some amount is converted to electricity, where most of the primary energy is wasted as heat, direct to the atmosphere or body of water. Solar only needs to replace the electrical energy demand, not the total primary energy input. Our World in Data estimates a total global electricity demand of 103.18 ExaJoules (28660.98 TWh). Using the BP thermal efficiency substitution figure for 2021 of 40.6%, this electrical generation would have required 254.14 ExaJoules (70593 TWh) of primary energy input. __The fact that primary energy used for electricity is 40% of total primary energy is a bizarre coincidence and has no relation to the BP thermal efficiency figure.
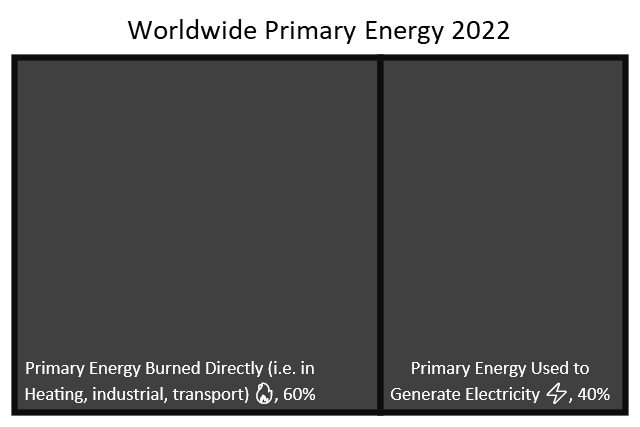
Of the primary energy used to generate electricity, 59.4% is converted to waste heat and only 40.6% is converted to electricity:
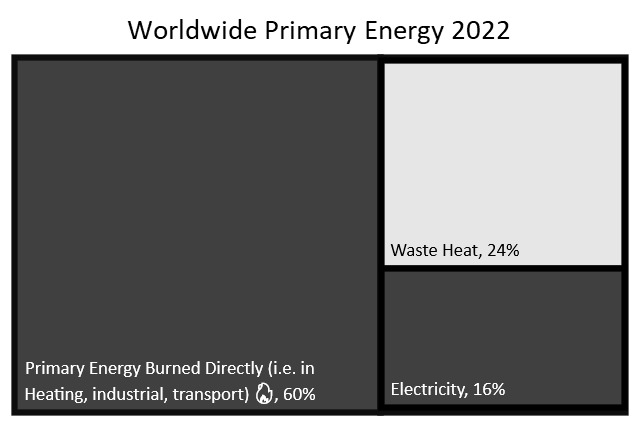
Therefore we can reduce the primary energy figure of 584 ExaJoules by 24% when determining the electrical energy that solar power would be required to replace.
Second assumption: efficiency from electrifying transport and heating
Electrifying heating and transport can theoretically make them more efficient. It is important to distinguish this from the fact that most of the fossil fuel energy used to generate electricity is waste heat, which we don’t need to provide at all—we’ve already accounted for this;
I delved into the electrification efficiency question separately. In summary, according to the most optimistic observers, we can hope to save 42.5% from:
- The higher energy-to-work conversion efficiency of using electricity for heating, heat pumps, and electric motors, and using electrolytic hydrogen in hydrogen fuel cells for transportation, compared with using fossil fuels (Table S4);
- The elimination of energy needed to mine, transport, and refine coal, oil, gas, biofuels, bioenergy, and uranium;
- Assumed modest additional policy-driven energy-efficiency measures beyond those under BAU.
These factors decrease average demand ∼23.0%, 12.6%, and 6.9%, respectively, for a total of 42.5%. Thus, WWS not only replaces fossil-fuel electricity directly but is also an energy-efficiency measure, reducing demand.
There are many mental gymnastics involved in getting to the number of 42.5% savings from electrification. I will ignore behaviour changes as energy demand will increase into the future as it has consistently for since industrialization. I will also ignore the energy cost of mining fossil fuels, as the energy cost of making solar panels, wind turbines and batteries can be expected to at least equal this. So we are left with 23.0% efficiency savings; primarily from the adoption of electric cars and heat pumps. Electric cars are 90% efficient as opposed internal combustion engines which are 35% efficient. Heat pumps can be more than 100% efficient, as they ‘steal heat from the environment’ and move it inside. I will downgrade this to a round number of 20% savings from electrification.
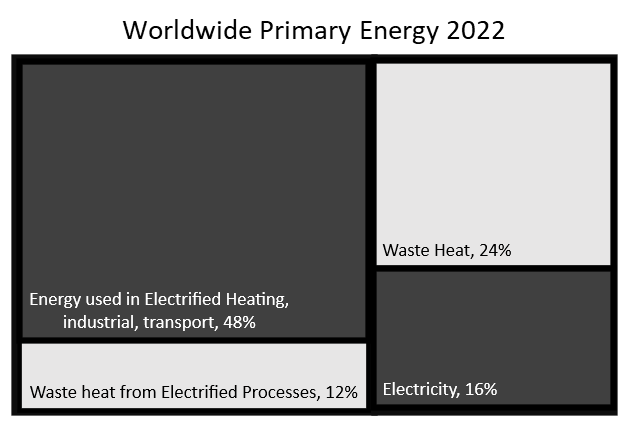
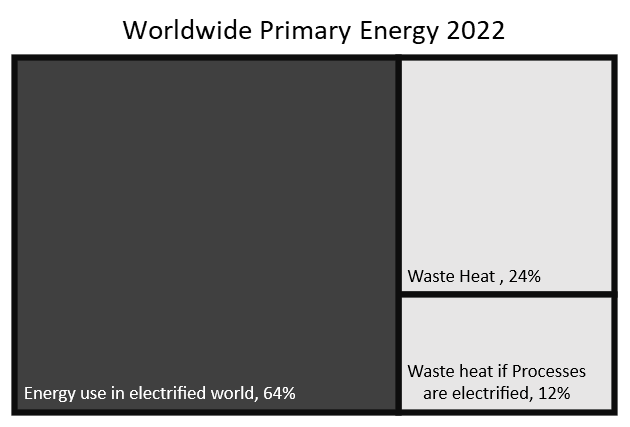
The energy requirements for a fully electrified world are thus only 64% of the total primary energy figure of 595 ExaJoules, approximately 381 ExaJoules.
Null Assumptions
Energy return on investment
https://en.wikipedia.org/wiki/Energy_return_on_investment The EROI of solar power.
A 2015 review in Renewable and Sustainable Energy Reviews assessed the energy payback time and EROI of a variety of PV module technologies. In this study, which uses an insolation of 1700 kWh/m2/yr and a system lifetime of 30 years, mean harmonized EROIs between 8.7 and 34.2 were found.
https://doi.org/10.1016/j.rser.2015.02.057
Let’s take a round number at the upper end of the range: 20. The EROI of oil gas and coal are all around 30. So although in reality the EROI of solar is significantly lower than fossil fuels, I will take the simplistic, benefitial assumption that the same amount of energy is used in the creation of solar panels as would have otherwise been used to mine the fossil fuels.
Demand growth
For simplicity let’s assume that the demand remains constant
Contributions of other sources of power
Hydro and wind are the main two alternative renewable resources which are touted as replacement. Hydro should clearly be installed wherever it is possible, and wind where economical but there is a near and present barrier to scaling both technologies, unless floating wind turbines can be deployed in the oceans.
Other technologies with a large theoretical capacity, that are not likely exist in an economic manner in the near future include: tidal and deep geothermal power.
I want to specifically address solar potential in this article, not the more complex question of whether renewables are viable overall.
Solar power per unit area
We can now begin to formulate a reasonable estimate for the net amount of electricity solar power can deliver, taking all lifetime costs into account. Essentially, we’re seeking to determine the average annual solar power output per unit of land area, expressed in electrical energy output, per second, per square metre. This is expressed in the unit of “watts” per square meter (W·m⁻²).
The capacity factor for each country can be obtained from the Global Photovoltaic Power Potential by Country dataset. This data, is compiled by Solargis and was funded by the World Bank.
The capacity factor is the actual output of the panels divided by the maximum output potential of the panels for a whole year. This is obviously better in sunny countries and worse in less-sunlit countries. The capacity factor also changes dramatically between winter and summer in countries which are far from the equator, so here we are looking at a year-average.
This data operates under the assumption of freestanding structures utilizing monofacial crystalline silicon PV modules, which are mounted at an optimal tilt to maximize annual energy yield. It also considers the use of high-efficiency inverters.
The data factors in solar radiation, air temperature, and terrain to simulate the energy conversion and losses in the PV modules and other components of a PV power plant. It presumes a 3.5% loss due to dirt and soiling, while the aggregate impact of other conversion losses—including inter-row shading, mismatch, inverters, cables, and transformers—is estimated at 7.5%. The power plant availability is assumed to be 100%.
The key column we need, labeled ‘Average practical potential kWh/kWp/day’ in the source data essentially represents the year-averaged capacity factor multiplied by 24. Refer to footnote for more details.
The average global capacity factor, weighted for land area, is 18%.
Main assumption: installed capacity
What is call the installed capacity is often called the ‘capacity density’, ’land-use efficiency’ or LUE in the literature.
The installed capacity per unit area depends on what sort of panel efficiency and layout density the solar farm can achieve. The relevant value is the “MW-ac” – the alternating current that it is capable of sending to the Grid after electrical inversion. This is approximately 80% of the “MW-dc”. Hereafter, I refer to MW-ac simply as MW.
- California Solar PV Land Use efficiency in 2013 was 35W/m2.
- The US Average Land Use efficiency in 2013 was 42.5 W/m2 (5.8 acres/MW) for a Fixed Axis, Large (>20MW) capacity-weighted average.
These are a bit dated. I have calculated an approximate estimate of the installed capacities of the largest solar farms in the UK.
- NextEnergy Llanwern Solar PV Park, UK (power-technology.com), 260 acres (1.05km²), 75 MWp: 71.4 W/m²
- BSR Shotwick Solar Park, Flintshire (britishrenewables.com), 220 acres (0.89km²), 72.2 MWp: 86.7 W/m²
- Power plant profile: Wymeswold Airfield Solar Park, UK (power-technology.com), 78 hectares (0.78km²), 34.4MWp: 43.7 W/m²
Let’s take the approximate mean value of the most efficient two plants: 80 W/m².
We can ignore the other minor factors of the embodied energy used to create the solar panel or the availability factor.
Therefore, the average annualized output is 14.4W/mm²,equal to 454 TJ/km²/year.
Using the approximate numbers of consumption: 381E+18 J and production: 454E+12 J/km², we can calculate a minimum gross area requirement of 840,000 km², only 0.64% of global land area!
With this crude calculation, it seems very feasible that we could in fact power the world with solar power. But there are some serious blocking issues.
- The storage required to overcome intermittency and achieve grid stability.
- The less sunny places use most of the energy.
- Material requirements and embodied energy requirements to rebuild this quantity of solar panels each 20 year are excessive
We can only power the world with solar power if we dramatically reduce per-capita consumption or population. Neither of these things are going to happen.